Project Overview
Nominal fares kept climbing every few years; but adjusted for inflation, riders have actually paid less since 2015.
Public transportation is not cheap! Inspired by New York City's January 2026 fare increase from $2.90 to $3.00, and the MetroCard's replacement by OMNY tap-to-pay, this project compares nominal and inflation-adjusted fare growth to answer one question: is the MTA's cost of commuting increasing too much?
This report focuses on base fares and the 7-Day and 30-Day unlimited MetroCard plans, with a brief look at the 1-Day and 14-Day passes. It doesn't cover reduced fare plans for seniors, students, low-income riders, or disabled individuals. Growth rates typically stay under 20% from 1998 to 2026 (Base and 7-Day fares in 2003 are the exception). The frequency of these increases, not their size, is what makes transit feel expensive. The base fare has increased 6 times since 1998; the 7-Day and 30-Day unlimited passes, 10 times.
$3.00
Base Fare (Jan 2026)
6×
increased
Base Fare Since 1998
10×
increased
7-Day & 30-Day Unlimited Since 1998
From personal experience, the rising costs leave a lingering feeling of dissatisfaction, especially when the service itself doesn't seem to keep pace with the price — paying more should come with getting more. Case in point: the 90th Street station (my most frequented stop over the last few years) has yet to rebuild the southside stairs, torn down over a year ago.
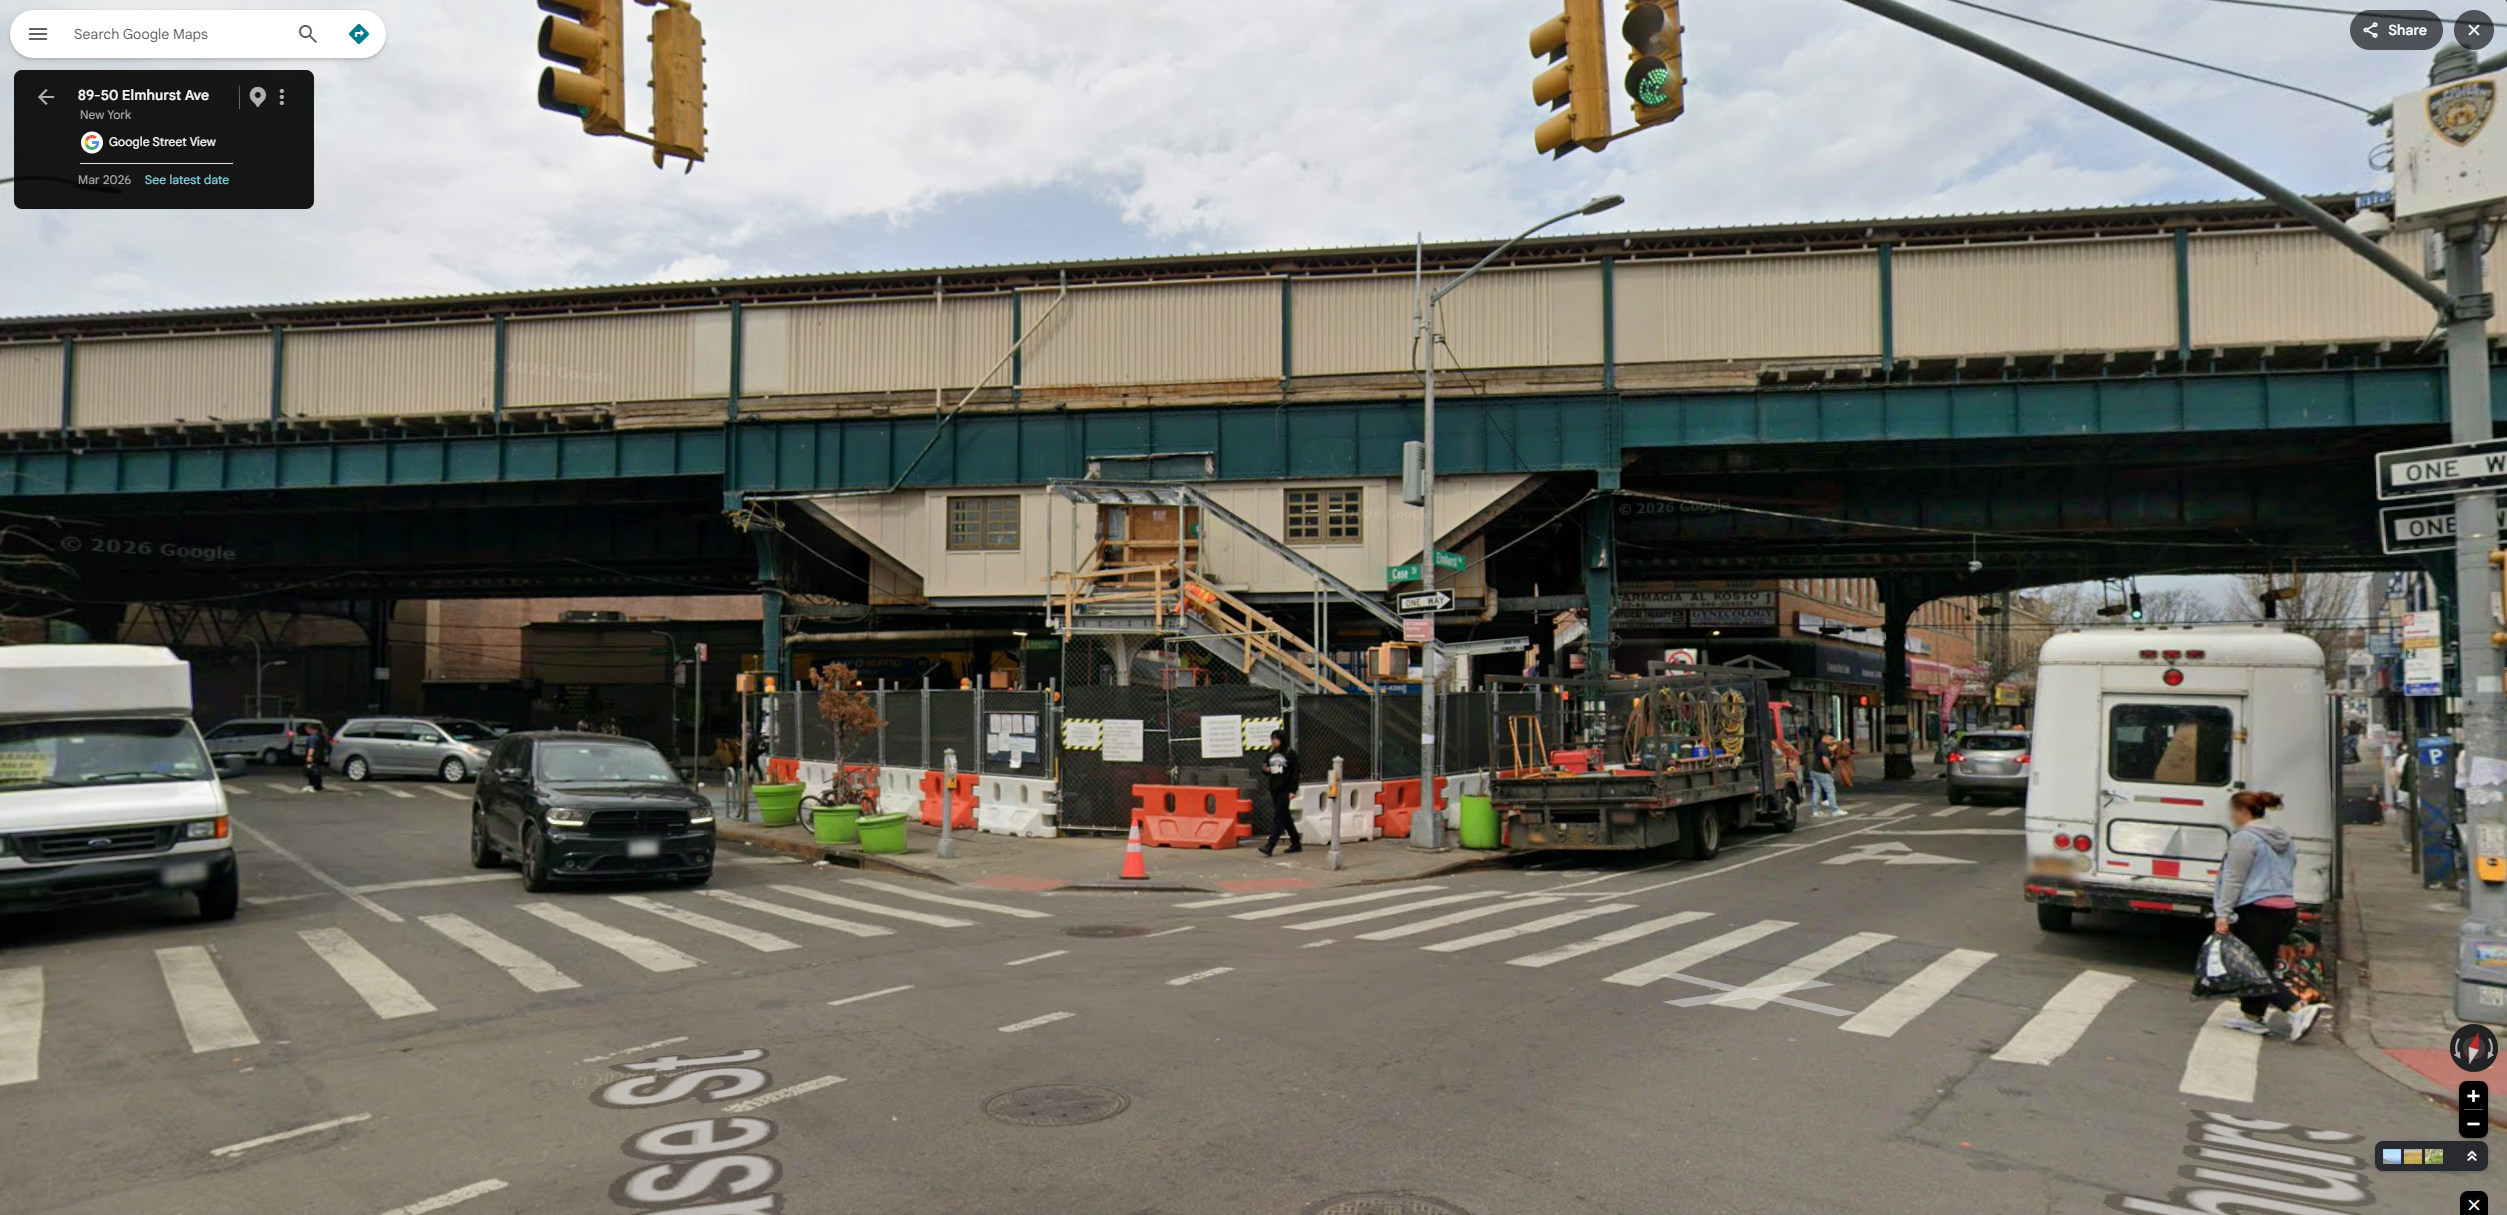
Screenshot via Google Maps Street View — not an original photo.
Background & Literature
The MTA (Metropolitan Transportation Authority) has offered MetroCards since 1994 to ride trains and buses in NYC. When refilling these cards, commuters were asked a nostalgic question: "Do you want to add more value or time?" — a question tailored to the commuter's needs that has now been replaced by the standard tap-to-pay system. Tap-to-pay replaces weekly and monthly MetroCard plans with a weekly spending cap at $35. Prior to this change, MetroCards were straightforward: adding value functioned like loading money onto a debit card, while adding time (the primary focus of this project) offered unlimited rides for 7 or 30 days. Unlimited rides for 1-Day and 14-Day were once offered alongside these options.
Source: MetroCard (MTA).
As a commuter who has lived in NYC since 2002, I was part of the MetroCard's brief history. However, the subway system has a much longer story involving nickels, fare increases, and fare evasion.
A Longer History: From IRT to MTA (1904–1968)
The privately owned Interborough Rapid Transit Company (IRT) first opened its subway line in 1904, charging 5¢ per ride; its trains were identified by numbers on the front and sides. This is unlike the Brooklyn-Manhattan Transit Corporation (BMT) and Independent Subway System (IND) lines, which were identified by letters. These systems were eventually unified and purchased by New York City in 1940, then placed under the New York City Transit Authority (NYCTA) in 1953, which still operates the subway and buses today as an MTA subsidiary. Oversight passed to the state-created MCTA (Metropolitan Commuter Transportation Authority) in 1965, which was renamed the MTA in 1968.
Source: History Associates: The NYC Subway System, 120 Years of Connections.
The discussion on rising fare costs has always been controversial. As with any service, rising costs are an attempt to bridge revenue with maintenance and are rarely met with open arms. After all, running a complex train system is not cheap. Fare evasion has been a long contributor to that cost and there have been many attempts to minimize that problem.
Data Collection
Inflation calculations start at 1913, not the subway's 1904 launch; CPI records simply don't go back further.
Inflation data (CPI) was pulled from the Federal Reserve Economic Data (FRED) API using Python. From 1904 to 1947, the base fare held steady at 5¢, before CPI records existed to adjust it against.
Fare history was compiled from previous MTA announcements and news coverage into a single spreadsheet. Data on reduced fares was not gathered but is being considered for a more in-depth report. A CSV version of the data can be viewed here. Inflation numbers were omitted for simplicity.
Historical Fare Prices
After compiling the fare history data and pulling yearly CPI data from FRED, both data sets were merged. Prices are adjusted to 2025 dollars, since FRED publishes each year's CPI by January of the following year; 2026 is omitted from the charts since a full-year average isn't out yet. This merged dataset feeds both the historical fare prices and growth rate charts below.
Real Fare = Nominal Fare × CPI2025 CPIyear
Toggling through the charts individually and examining the inflation-adjusted prices reveals a complicated story. For all fares, both nominal and adjusted prices show a long-run upward trend. However, after 2015, adjusted prices start moving down for the base, 7-Day, and 30-Day fares. The base fare saw no nominal price changes from 2015 to 2022 ($2.75 for that period) — in 2017, the MTA considered raising it to $3 but rejected the idea, raising the 7-Day and 30-Day fares instead, a move it repeated in 2019. When the freeze ended in 2023, the base fare rose by $0.15 — still not enough to match its earlier adjusted price ($3.74 in 2015 vs. $3.06 in 2023). The 30-Day fare didn't decline right away, though: adjusted for inflation, its 2019 price was still higher than in 2015. By contrast, the 7-Day fare was already $0.55 lower in 2019 than in 2015 (adjusted).
Base, 7-Day, and 30-Day fares all roughly doubled in nominal price from 1998 to 2025 ($1.50 to $2.90, $17 to $34, $63 to $132). The 7-Day fare hit that mark exactly, the base landed just under, the 30-Day just over.
Growth Rates by Fare
Growth rates for nominal and adjusted fare prices were calculated year-over-year. Growth rates are only shown on the year the change occurred to ensure the chart is not overcrowded. The dashed line overlaid on the growth-rate charts represents a cubic trendline fit to those years where hikes occurred. This helps visualize the general trajectory of price growth.
Growth Rate = Fareyear − Fareyear−1 Fareyear−1 × 100%
Note: Hover over individual bars to view price shifts. The percent change for the adjusted 7 day unlimited fare is nearly 0 in 2008. The adjusted fare for 2007 is $37.27 and $37.38 for 2008.
Base and 7-Day fares peaked early (2003) then cooled off; the 30-Day fare's steepest hikes came later, in 2011.
From 1998 to 2025, the base and 7-Day fares track each other closely: a concave downward trend, with their sharpest increase in 2003 and smaller increases as time went on. That 2003 hike, therefore, marked their peak rather than the start of an accelerating trend.
The 30-Day fare is the opposite: a convex shape, with its steepest nominal and adjusted price change arriving in 2011 rather than early in the MetroCard era. Where the other two fares front-loaded their steepest hikes, the 30-Day fare's accelerating curve suggests monthly unlimited riders absorbed a growing share of the more recent increases. This also suggests that the 30-Day fare was heavily undervalued in the first half of its lifetime.
The base fare changes price about once every 5 years.
The 7-Day and 30-Day fares change about
once
every 3 years.
The base fare has changed price 18 times since 1904 — 6 of those within the 1998–2026 window this report focuses on (the graph omits the 2026 increase to $3) — with the longest gap between changes running 8 years. The 7-Day and 30-Day fares changed price 11 times over the same 1998–2026 span, with gaps never longer than 4 years (2019 to 2023).
Key Findings
-
Nominal Increases, Adjusted Decreases
Despite nominal fares climbing for the base, 7-Day, and 30-Day passes, their
inflation-adjusted prices have generally fallen since 2015 —
meaning these hikes have actually lagged behind inflation rather than outpaced it.
This finding partially answers the initial project question: Is the MTA's cost of commuting
increasing too much?
In real terms, no — riders are paying less today, adjusted for inflation, than they were a decade ago. But commuters don't experience the adjusted number; they experience the sticker price. Every nominal increase reads as a new expense regardless of what inflation is doing underneath it, especially alongside the frequent problems commuters face with the service itself. - Front-Loaded vs. Accelerating Growth The base and 7-Day fares grew fastest early on (peaking in 2003) then tapered off, a concave pattern. Conversely, the 30-Day fare grew convexly, with its steepest hikes arriving later in 2011 — meaning monthly unlimited riders have absorbed a growing share of recent increases even as the other fares cooled.
- Smaller Hikes, Higher Frequency Returning to the report's central question, commuters have generally enjoyed smaller price increases — but the issue lies in their frequency: the longest stretch without a price increase is 4 years for the 7-Day and 30-Day fares (which typically change every two years). From 1998 to 2026, the base fare went almost 8 years without a price change (2015–2023), and changed price only 6 times overall.
Data Sources
Historical documents and news outlet sources used to collect data on fare price changes are linked below. The following is grouped by the fare type and the respective year these changes took place.
Base Fare
-
1904–2023
All the MTA fare hikes over the last 100 years (6sqft)
Base fare debut in 1904 at 5¢ and tracked until 2023.
-
2023–2026
MTA 2026 fare hikes are in effect. Here's what NYC Commuters are paying (CBS NY)
Base fare price increased to $3 from previous price $2.90.
7-Day Unlimited & 30-Day Unlimited
-
1998–2015
A Fairer Fare Increase (CBC)
$17 7-Day, and $63 30-Day fare passes debuted in 1998. Features an intensive historical price analysis and tracking.
-
2017
NYC MTA Fare Increase 2017 (Mic)
Inevitable base fare price increase to $3 delayed at the cost of raising weekly($31 to $32) and monthly($116.50 to $121) fare prices.
-
2019
Here's How to Choose the Best MetroCard for Your Commute (Queens Daily Eagle)
Price increased for weekly ($32 to $33) and monthly ($121 to $127) fares.
-
2023
New Fare Information (MTA)
MTA pdf detailing price increased for base ($2.75 to $2.90), weekly ($33 to $34), and monthly ($127 to $132) fares. Mentions reduced fare plans not covered in this analysis.
-
2026
MetroCard (MTA)
All physical MetroCards phase out by January 1st 2026 in favor of Tap to Pay. Can no longer purchase or refill physical card.
1-Day Fun Pass & 14-Day Unlimited
-
1998
How Unlimited MetroCard Revolutionized Transit (Second Ave. Sagas)
Brief history on unlimited MetroCards. $4 Fun Day Pass, $17 7-Day, and $63 30-Day fare passes debuted in 1998.
-
2003
Riders Buying In Bulk (New York Post)
Fun pass increased from $4 to $7.
-
2008
All About the MTA Fare Increase (The New York Times)
14-Day pass debut at $47. Fun pass increased from $7 to $7.50.
-
2009
MTA Subway Fare Hike Takes Effect On Sunday (New York Daily News)
Price increased for Fun pass ($7.50 to $8.25), and 14-Day ($47 to $51.50) fares.
-
2010
MTA Sets Grace Periods for Unlimited MetroCards After the Fares Rise Dec. 30 (New York Daily News)
End of Fun Day and 14-Day passes.